Exosome Extraction | Exosome Characterization | Exosome Functional Validation | Exosome Proteomics | Exosome Nucleic Acid Omics

TECHNICAL SERVICE
TECHNICAL SERVICE

 0512-69885880 商务合作:17390950250 李女士
 LynnY@carrierbiomed.com
 AI Industrial Park, No. 88 Jinjihu Avenue,Suzhou Industrial ParkE2-201


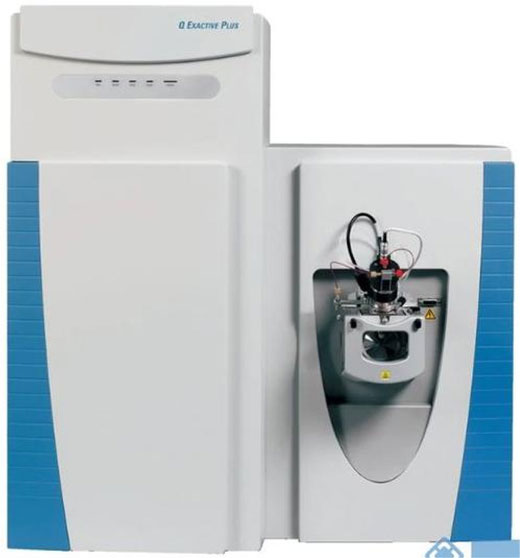

 Schematic diagram illustrating the principle of mass spectrometry identification